

Price chart
The price chart is printed twice on a piece of cardboard of the same quality as the game board. This measures 109 by 174 mm, and is folded in the middle to form a ‘V’ shape with the fold at the top and one copy of the chart on either side. A metal clip is placed atop the fold, indicating which of the eight numbered columns is currently active, requiring the columns to be ordered in the opposite direction on the two sides. The clip starts at column ‘1’ and is moved in increasing numerical order (right or left depending on which side of the chart one is looking at), and from ‘8’ back to ‘1’.
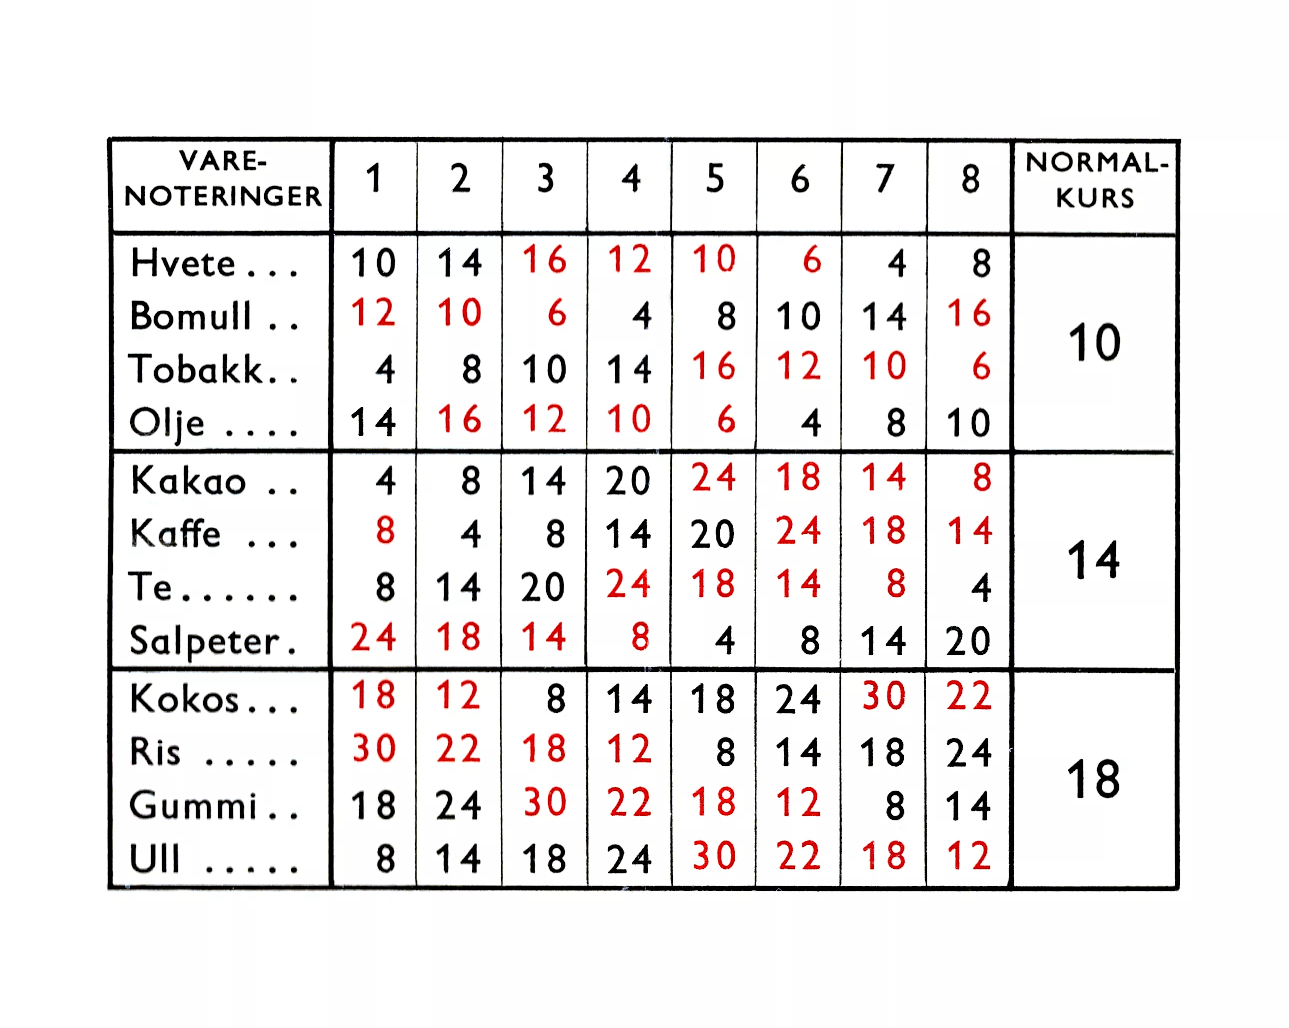
This makes the value of each commodity vary in a fixed cyclical pattern. Within each of the three groups of four commodities, this pattern is identical, but offset from each other in time. The average price is thus the same for all commodities in each group, and is indicated in the column headed normalkurs. These numbers are rounded to the nearest whole number; the exact averages of the lower two are 13.75 and 18.25 respectively, rather than the given 14 and 18.
PDF file with both sides of the price chart – cropping marks are solid, while the folding guide is dashed.

The clip is made from a 0.3 mm thick sheet of spring steel. It is rectangular with a circular protrusion at one end, which is painted with enamel paint. In the Norwegian versions I have seen both red and green paint, in the Danish yellow. A “finger” is cut out from the rectangular part. This is made more rigid by having a central ridge punched out to about the sheet thickness, and is afterwards bent out from the plane of the clip, but parallel to it.
Tor Gjerde <i@old.no>